Smart reporting provides a highly simplified, wizard-like process for building visuals that are then saved and embedded within your publication. You can follow this streamlined process to create new one-off visuals if you want the flexibility of creating your visuals "on the fly," and do not need those visuals to be shareable with other users in the first instance. Smart Reporting is a good solution for those users who want to build their visuals quickly, without the need for all the sophisticated functionality that is afforded by Discover Lite.
In Publish Lite, the Smart Reporting tool is available from the left-hand Toolbox. All you need to do is open it from the toolbox, select the data model that contains your data, and pick the Dimensions, Measures, and Filters that you want to show in your visual.
Alternatives to this process include either using existing visuals from the content management system or using the Discover Lite tool to build a new one-off visual:
- Click here for more information about adding existing visuals
- Click here for more information about using Discover Lite
Building New Content
Before you begin
You need to have created the publication that you want to add your visual to. For details, see Building a New Publication in Publish Lite.
Create your visual
Create or select a page
Before you begin, you need to open the page that you want to add your new visual to. This may be a page that already exists in your publication or a new page created for the new visual.
From the Pages panel:
- Select the relevant snapshot.
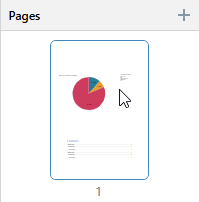
The selected page is highlighted in the Pages panel and opens on the canvas for editing.
Tip: You can also add a new page by clicking the Plus (+) icon at the top-right of the Pages panel.
The page opens on the canvas.
Run the Smart Reporting tool
The Smart Reporting tool is opened from the left-hand Toolbox, and steps you through data selection for your visual. Pyramid then uses your selections to build the most appropriate type of visual, given your selections.
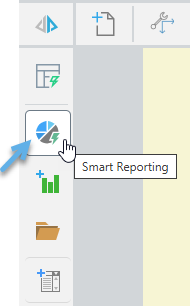
- Click Smart Reporting (blue highlight above).
- Select the data model that contains your data. You can select a model from your Recent or Favorites views or navigate through the Explorer view to your model.
- In Smart Reporting, you can start building your discovery using one of the following options:
- Use the Chatbot (purple arrow above) to describe the data you want to add to your discovery. A prompt like "Sales by Manufacturer by Country" will add multiple chips to the Item Selection bar above the canvas.
- Click Select Data + (green arrow) to add measures (quantitative data) and then hierarchies or filters (qualitative data) to your visual. Note that each time you make a selection, a chip is added to the Item Selection bar and the visual is redrawn.
- The first time you access this panel you can only add Values (also called Measures).
- Subsequently, you can add Values, Dimensions, or Filters.
- Click here for the help materials for Smart Reporting.
- Once you have built your visual, click Finish.
The Model Selection panel opens with your Favorites displayed by default.
For detailed steps describing this process, see Opening a data model in the Discover section of this help file.
![]()
You can also change the visualization type, change your theme, and change the quick styles in Smart Reporting. For an overview of the Smart Reporting tool, see:
Smart Reporting closes. Your new visual is created and embedded in your presentation or publication.
What next?
Once you have added your visual, you might want to:
- Resize your visual: Select the panel and drag its handles to fit the space.
- Rename your visual: Right-click the panel, select Rename Title, and supply a new title.
You might also want to add additional content items to the canvas, including additional visuals, text, shapes, images, and so on.
Other tools
You might want to open your visual in Discover, Illustrate, or Tabulate to update it. Given the appropriate access rights, you can do this using the Open options on the right-click context menu.
Make your visual "shareable"
The visual you just created is a "one-off" that only exists inside your publication. If you want to view and edit it outside of the publication, or you want other users to be able to share and edit it, you need to either:
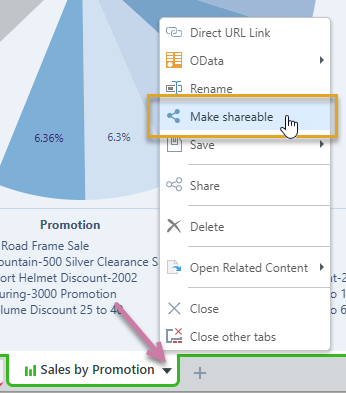
- Select it and choose Make Shareable on its right-click context menu.
- Open it in Discover Lite (right-click Open in Discover) and select Make Shareable from its App Tabs menu (purple arrow below):